Number to Words

From Data to Dollars: How Number Formatting Impacts Readability in Financial Reports

Number Formatting in Financial Reports

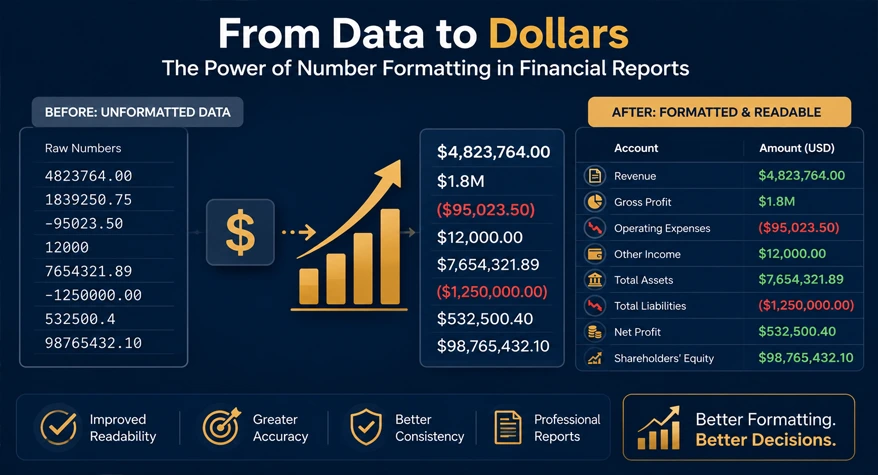
If you’ve ever looked at a financial statement and felt your eyes start to glaze over, the issue is probably one of how those figures have been formatted or not formatted. Raw numbers, stacked one after another without commas, matching decimal points or good dollar signs, can make a solid argument unreadable.

This is not a matter of aesthetic style. Every significant decision that you make in your financial report is impacted by the way in which you choose to format the numbers therein.

Let’s analyze why number formatting in financial reports is so important and how to do it.

Why Number Formatting Is a Business Communication Issue

Numbers tell stories. But unformatted numbers tell them badly.

Now let’s consider: Which one is read more quickly, 4823764 or 4,823,764? The answer is clear. Yet issues like this are repeated thousands of times a day within your financial statements, balance sheets, investor decks, and quarterlies.

Let’s say a stakeholder (a CFO, a director, a board member, an auditor, or a departmental head) snatches a printed financial statement: he or she doesn’t read through it, he or she scans it. Inconsistently presented, unformatted numbers force him or her to slow down and risk being misled.

A decimal point in the wrong place. A comma that has been left out. A currency character that is shown on some rows but not on others. These aren’t merely visual errors. They can lead to genuine misinterpretations that impact business decisions.

The Real Cost of Poorly Formatted Financial Data

Most people underestimate how much poor financial data formatting actually costs — not just in time, but in trust.

It makes decision-making slower. If the numbers do not balance, users need extra brainpower to comprehend the scale of every number. This stacks up quickly in a report with hundreds of numbers.

It shows a lack of professionalism. An investor or an auditor reading through a report with variable formatting will pick up on it. It appears petty, but it can introduce a small doubt about whether the data might also be inconsistent.

It introduces errors for further analysis. If numbers in a report are pasted into some other database or spreadsheet without uniform formatting, values can be misread or misentered, leading to further errors.

It complicates audits. Auditors and compliance groups depend on uniform, easy-to-handle number formats to make their audits easier. If the data is disorganized and not well-formatted, they have to go back and forth more often, extending the review process.

Common Number Formatting Mistakes in Financial Reports

Knowing what the problem is is the first step to fixing the problem. Here are the common errors faced when formatting financial documents:

  • Inconsistencies in the use of commas: a few use commas to separate, many do not.
  • Decimal places don’t match: One row has two decimal places, one has four, one has none.
  • Missing or inconsistent currency symbols: Dollar signs are present on some line items, but not on others.
  • Unaligned columns: numbers stretch far apart along the table, creating minuscule numbers at the bottom of the report.
  • Large numbers written without abbreviation or symbol: Writing 47000000 instead of 47,000,000 or $47M creates confusion.
  • Mixing formats of numbers within the same table: some millions, others thousands, but not indicating which.

All of these would be avoided if the mistakes weren’t made in the first place. Many result from figures being input manually into one of several tools by several people on the team without a common format.

Financial Data Formatting Best Practices That Actually Work

Getting your number formatting right doesn’t require a style guide the size of a textbook. These principles cover most use cases in financial reporting.

Use Thousands Separators Consistently

Every number above 999 should include a comma (or period, depending on locale) as a thousands separator. This applies to every figure in the document — not just the large ones. Consistency matters as much as the format itself.

Align Decimal Places Across the Same Category

If you’re reporting revenue figures to two decimal places, every revenue figure in that section should follow the same rule. Mixing precision levels — even unintentionally — makes it look like the data was pulled from different sources without reconciliation.

Establish Clear Currency Labeling

You don’t have to place a dollar sign before every number if the currency is made obvious in the table header. Just be consistent. $1,200 in one location and 1200 USD in another is quite formless and sloppy.

Use Abbreviations for Very Large Numbers — With Labels

For reports that are referring to millions or billions of dollars, it can be run as $4.2M or $1.8B on executive summaries and dashboards. However, just be sure to define the abbreviation there for the first-time viewer.

Negative Numbers Need Clear Treatment

In financial reporting, negative values — losses, liabilities, variances — should be presented consistently. The two most accepted formats are parentheses like (4,500) or a minus sign like -4,500. Pick one and don’t switch between them.

Round Thoughtfully, Not Arbitrarily

Rounding to the nearest dollar is fine for most reports. Rounding to the nearest thousand or million is acceptable in high-level summaries. The key is declaring your rounding approach upfront so readers know the figures are approximations — and by how much.

Manual vs. Tool-Based Formatting: What’s the Smarter Choice?

Here’s the honest reality: manually formatting numbers across a large financial report is tedious, inconsistent, and error-prone.

When you’re working with a dataset of 200 line items and formatting each one by hand, you will make mistakes. Not because you’re careless — but because manual repetition introduces human error by nature. You’ll miss a comma somewhere. A decimal will slip. A column will end up inconsistent with the rest.

Tool-based formatting removes that risk.

Using a dedicated tool like the Number Formatter lets you apply consistent formatting rules to your figures in seconds. You can set your preferred thousands separator, decimal places, currency symbol, and number style, then format an entire list of values at once. No inconsistencies. No manual review needed.

The time savings alone make it worthwhile. What might take 20–30 minutes of careful manual formatting gets done in under a minute. And when you’re preparing a report under deadline pressure, that difference is significant.

More importantly, you get accuracy. Every number follows the same rule. Every decimal line up. Every large figure is formatted the same way. That consistency is what makes financial reports look professional and trustworthy.

How Consistent Formatting Improves Readability of Financial Reports

The link between formatting and readability is well established in information design. Our brains process structured information faster than unstructured data. When numbers follow a predictable pattern — same separators, same decimal depth, same alignment — readers absorb them more quickly and with less cognitive effort.

This matters most in financial reporting because the stakes are higher. A CFO skimming a board report needs to identify key figures in seconds. A department head comparing quarterly performance needs to spot variances at a glance. An auditor scanning a balance sheet needs to trust that the numbers are what they appear to be.

Well-formatted financial data makes all of that easier. Poorly formatted data makes all of it harder.

There’s also a subtler effect at play: formatting communicates care. A report where every number is clean and consistent signals that the person who prepared it paid attention to detail. That perception matters when the document is going to investors, executives, or external stakeholders.

Applying Best Practices to Different Types of Financial Documents

The same core principles apply across different document types, but the specifics vary slightly depending on the context.

Income Statements and P&L Reports

These typically deal with figures in the thousands or millions. Use consistent decimal places (usually two for dollar amounts), clear negative formatting for losses, and thousands separators throughout. If the report covers multiple periods, make sure the format is identical across all columns.

Balance Sheets

Precision matters here. Every asset and liability figure should align perfectly, and totals should be visually distinct — usually through bold formatting or a separator line — so readers can immediately identify subtotals and grand totals.

Budget vs. Actual Reports

Variance columns deserve special attention. Clearly label whether a positive variance is favorable or unfavorable, depending on whether you’re looking at revenue or expense. Use color or parentheses to distinguish negative variances, and keep decimal consistency tight since small differences carry meaning in these reports.

Executive Dashboards and Summaries

Here, brevity and clarity win. Rounded figures, clear abbreviations, and minimal decimal places make dashboards easier to scan. You’re not trying to show every decimal — you’re trying to communicate the big picture fast.

A Note on Report Presentation Beyond Numbers

Number formatting is the most critical element of financial report readability, but it doesn’t exist in isolation. The text surrounding your data also needs to be clean and professional.

If those narratives are part of your report summaries for executives, explanations, special notes, or explanations of variances, the words themselves must be consistent in the way they are capitalized, punctuated, and grammatically constructed. Use the Sentence Case Converter to quickly keep your report text consistent.

Small details like that add up. A financial report where both the numbers and the text are consistently formatted simply reads better — and looks more credible.

Conclusion

Number formatting in financial reports isn’t a small detail — it’s a communication strategy. Every formatting decision you make affects how to format numbers in reportshow quickly your data is understood, how much trust it generates, and how professionally your work is perceived.

The financial data formatting best practices covered here — consistent separators, aligned decimals, clear currency labeling, thoughtful rounding, and standardized negative number treatment — aren’t complicated. But they make a real difference in how to improve the readability of financial reports and how your reports land with the people reading them.

The best way to ensure consistency across any financial document is to stop formatting manually and start using a purpose-built tool. The Number Formatter takes the guesswork out of the process, letting you apply your preferred format rules to every number at once — saving time, eliminating errors, and producing reports that are ready to share.

Because in financial communication, the numbers have to be right. And they have to look right, too.

Frequently Asked Questions

1. What is the most appropriate number format for financial statements?

The most common style uses thousands separators (i.e., commas), 2 decimal places on monetary value, consistent currency identifier, and parentheses or a dash for negative values. This is the most important point: regardless of the style you choose, at least be consistent! People will scan the document and compare figures, so follow it until the end.

2. What effect does the use of formatting numbers have on the clarity of financial reports?

Format and structure play a big part in reducing the workload when reading a report. If a set of numbers is structured to be the same (same separators, similar number of decimals, similar alignment) then they can be processed more quickly, with less chance of misinterpreting a number. It also presents the report as professional, which gives stakeholders confidence in the information.

3. Should I use abbreviations like $4M in accounting statements?

Yes, abbreviations are acceptable at the executive summary, dashboards, summaries, and high-level overviews where speed is of the essence. The best practice is to always define the abbreviation somewhere in the document, always use the abbreviation consistently, and never use the abbreviation in the more detailed financial statements (balance sheet or audit-ready income statement).

4. How do I display negative numbers in profit and loss statements?

The alternate two formats are to use the parentheses, i.e., (3,500), or use a minus sign -3,500, and both are acceptable in financial reporting. Decide which one you want to use and be consistent throughout the report. Using both formats in the same report causes confusion. It is difficult to follow the variance columns where the negative or positive sign has a specific meaning.

5. What results in inconsistent numeral style in financial reports?

Inconsistencies are common where many people may work on the same document, where data is being extracted from various systems with various default settings, or where figures may be formatted manually without a style guide to refer to. The simplest solution is to ensure that figures are exported through one piece of software before being input into the report, so all figures are formatted to the same standards.

Leave a Reply

Your email address will not be published. Required fields are marked *